|
INTRODUCTION
Plant species are able to thrive by living within environmental and climatic conditions best suited to each species requirements. Species are found to live within a geographic range that coincides with recurring seasonal climatic conditions (Grace, 1987). In the face of changing climate, the climate variables that define geographic ranges of species occurrence will change. The severity of these changes will define new geographic ranges and the species within them. Forests are of great concern to these changes as composition, structure, and health will be altered by changes in temperature, moisture, and disturbance (IPCC, 2007). The ability to predict what species will be threatened the most under different future climate scenarios will be paramount to determining conservation efforts, forest management decisions, silviculture prescriptions, and land use changes.
This study uses ClimateWNA software. This approach improves the accuracy of climate statistics, computes up to 36 important bioclimatic variables, and uses latitude, longitude, and elevation to correspond geographic location (Hamann & Wang, 2013). This software is able to predict future climatic variation in areas where topographic diversity can substantially vary from a region’s typical climatic conditions (Hamann & Wang, 2006). The use of this approach is leading to improvements in data, the incorporations of other bioclimatic variables, and the improvement of spatial resolution (Iverson, 2012). With all this attention, research in species distribution shows a movement of species up in latitude for many parts of north America (McKenney, 20011; Iverson, 2012; Hamann & Wang, 2006). Furthermore, this software has been used to study spatially distributed fire regimes, vulnerability among different tree species, resistance characteristics among different tree species, as well as other applications (Whitman et al., 2015; Coops & Waring, 2011; Bansal et al., 2016). |
OBJECTIVES
1. Visualize how species tolerance of 24 tree species throughout Western North America might be affected under 4 different climate scenarios.
2. Quantify the percentage of each species that will be threatened by drought for two climate scenarios under two future timeframes. 3. Identify which of the 24 species is most threatened by future droughts. 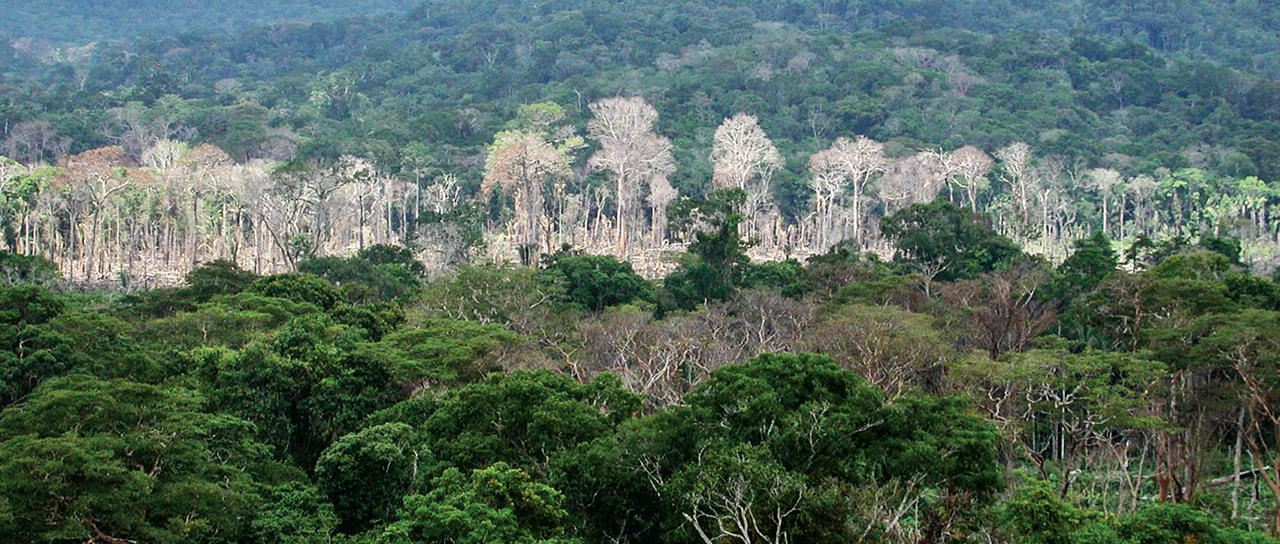
Image 2. Effects of drought in the Amazon rainforest.
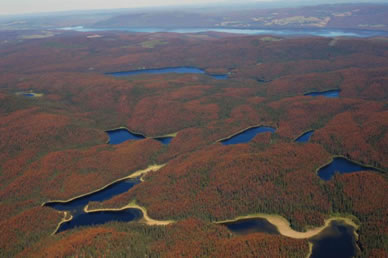
Image 3. Landscape scale mountain pine beetle infestation in Canada.

Image 4. Examples of base maps for different climate variables associated with ClimateWNA. Retrieved from https://sites.ualberta.ca/~ahamann/data/climatewna.html
|
MORE DETAILS
For this project, comparisons will be made between a past dataset that represents normal growing conditions for species and datasets that represents predicted future scenarios. Values for climate variables from the future datasets that shift beyond the values from the past data can lead to inferences about changing species tolerance, distribution shifts, and proportions of threatened species populations. The climate variables used in this study include mean annual temperature, mean annual precipitation and the Hargreaves climatic moisture deficit (CMD). The moisture variable is the sum of the monthly evaporation from the atmosphere minus the monthly precipitation. It is meant to be a measure of the amount of moisture needed for a plant to sustain growth through moisture deficit or drought events (Wang, 2012). The Hargreaves climatic moisture deficit will be the focus of this project as this variable is best suited to describe a species tolerance to drought. This project will look at individual species as well as all species together to determine and visualize the extent and severity of predicted changes in climate for 2050 and 2080 under 4.5 and 8.5 RCP emission scenarios. An increase in temperature for all predicted scenarios is expected. However, species response to moisture deficits are less predicable and vary between species. Species ability to adapt to drought depends on many factors including latitude, forest structure and compositional characteristics, individual species, as well as severity and frequency of drought events (Brodrick et al., 2019). As such, species response to Hargreaves climatic moisture deficit (CMD) will vary from species to species, but is likely to have an increasing affect through an increase in time and emission scenario. |
