The data tables for each scenario are compiled into one file. The first 7 columns are the meta data describing the location and elevation from each weather station. The predictor variables are the species occurrence columns and the response variables are the climate variables from the past 1961-1990 data and the climate variables for the different future scenarios. The past data acts as a baseline measure to compare future scenarios against. The only manipulation that took place was the exclusion of the top 5% for CMD from the past as well as the exclusion of data that was outside this range for each scenario. Species data was indicated by a 0 if a species is absent and a 1 if a species is present (Table 1). These individual columns were subset into one species column showing only species where cells equal 1.
Table 1. Screen capture of final dataset without all scenarios to fit in species columns.


|

|

|
|
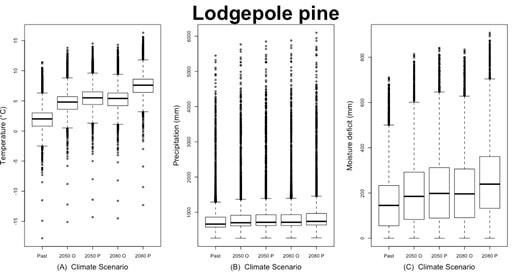
Figure 3. A selection of species boxplots. Plots A, B, and C correspond to mean annual temperature, mean annual precipitation, and Hargreaves climatic moisture deficit (CMD), respectively. From left to right, boxplots show 1961-1990 (past), RCP 4.5 2050, RCP 8.5 2050, RCP 4.5 2080, and RCP 8.5 2080
Shifts can be visually identified by creating boxplots for a selection of tree species with the different scenarios along the x-axis and the unit of measurement for a specific climate variable on the y-axis (Figure 6). Tree species like White spruce and Douglas fir show relative resistance to threat from changes in precipitation and moisture deficit for all scenarios. While temperature shows the most variation between climate scenarios for most species. To compare the boxplots, we can compare each climate scenario to the past boxplot or compare between the different emission scenarios for the same time period. The degree to which a boxplot shifts beyond the boxplot of comparison represents the amount of the species population which is threatened. This shift represents a clear message to warn analysts early on in data processing of a possible threat to this species tolerance in the future.
Species occurrence and distribution across Western North America

Figure 4. Distribution of all species from 1961-1990 across study region using Hargreaves moisture deficit as base map layer.
|
Figure 5. Selection of 14 species from species occurrence dataset using elevation as a base map layer. Distribution of occurrence across study region in pink.
|
