This project utilizes tree species occurrence data from over 55 thousand weather stations across western north America for 24 different tree species. A climate modeling software is used to generate climate scenarios for past climate from 1961-1990 and future climate for RCP 4.5 and 8.5 emission scenarios for 2050 and 2080. The species occurrence data is then attached to these different climate scenarios through spatial coordinates and exploratory analysis is conducted. The past data set is meant to illustrate a pre-warming timeframe, where the assumption that tree species occurrence and climatic conditions represent individual species tolerance. An increase in tree species occurrence outside the normal range for different climatic variables under different climate scenarios was observed. This increase in tree species leaving the past climatic range is characterized as species threatened because of the assumption that species survival and regeneration is only optimized for the prewarming conditions. This project provides visualizations of these shifts in species tolerance, the proportion of each species likely to be threatened under each scenario, and maps to show spatial distribution of these shifts. The results focus on the Hargreaves climatic moisture deficit variable, which represents a moisture deficit value. The values for the Hargreaves climatic moisture deficit variable for each future scenario that soar above the range of moisture deficit from the past can be interpreted as future drought conditions. Under this analysis we found Colorado pine to be at most risk with 70% of its species occurrence under these drought conditions for the 2080 pessimistic scenario. If these models are correct, the generation of this data and visual aids like maps will help bolster an effort to prioritize conservation efforts and research initiatives.
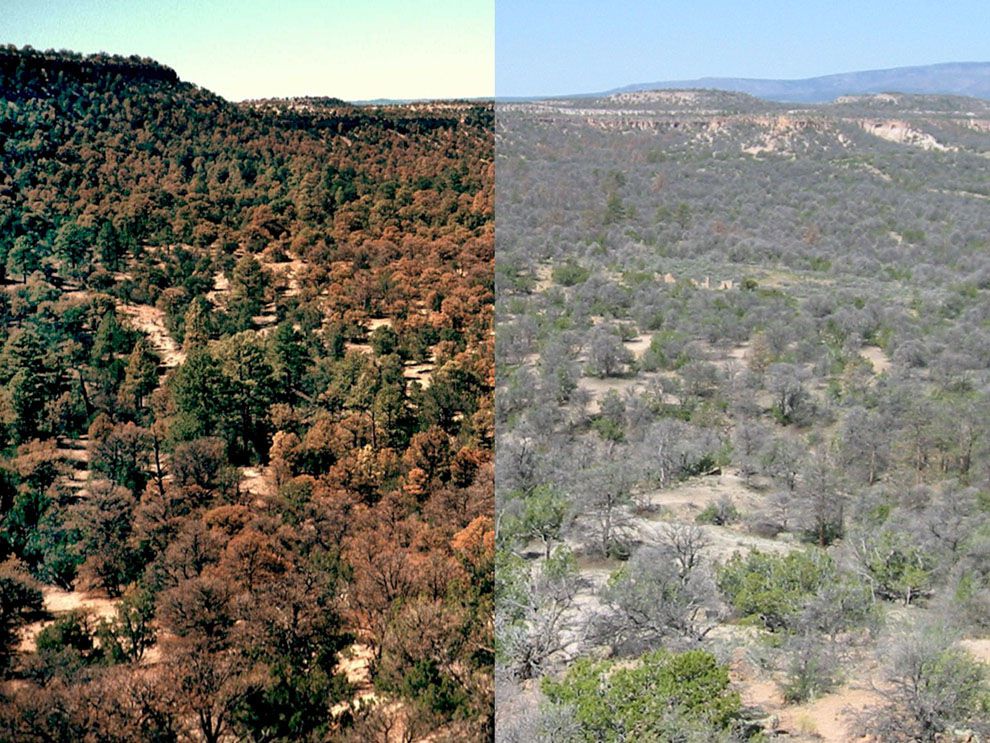
Image 1. New Mexico pine forest before and after drought in 2002
